Energy analytics · Individual project
Smart Power Netherlands
A historical decision-support project exploring when flexible electricity use can shift toward lower-cost, lower-carbon hours.
- Sources
- 4 external APIs
- Dataset
- 1,170 hourly records
- Scope
- Historical prototype
A decision pattern
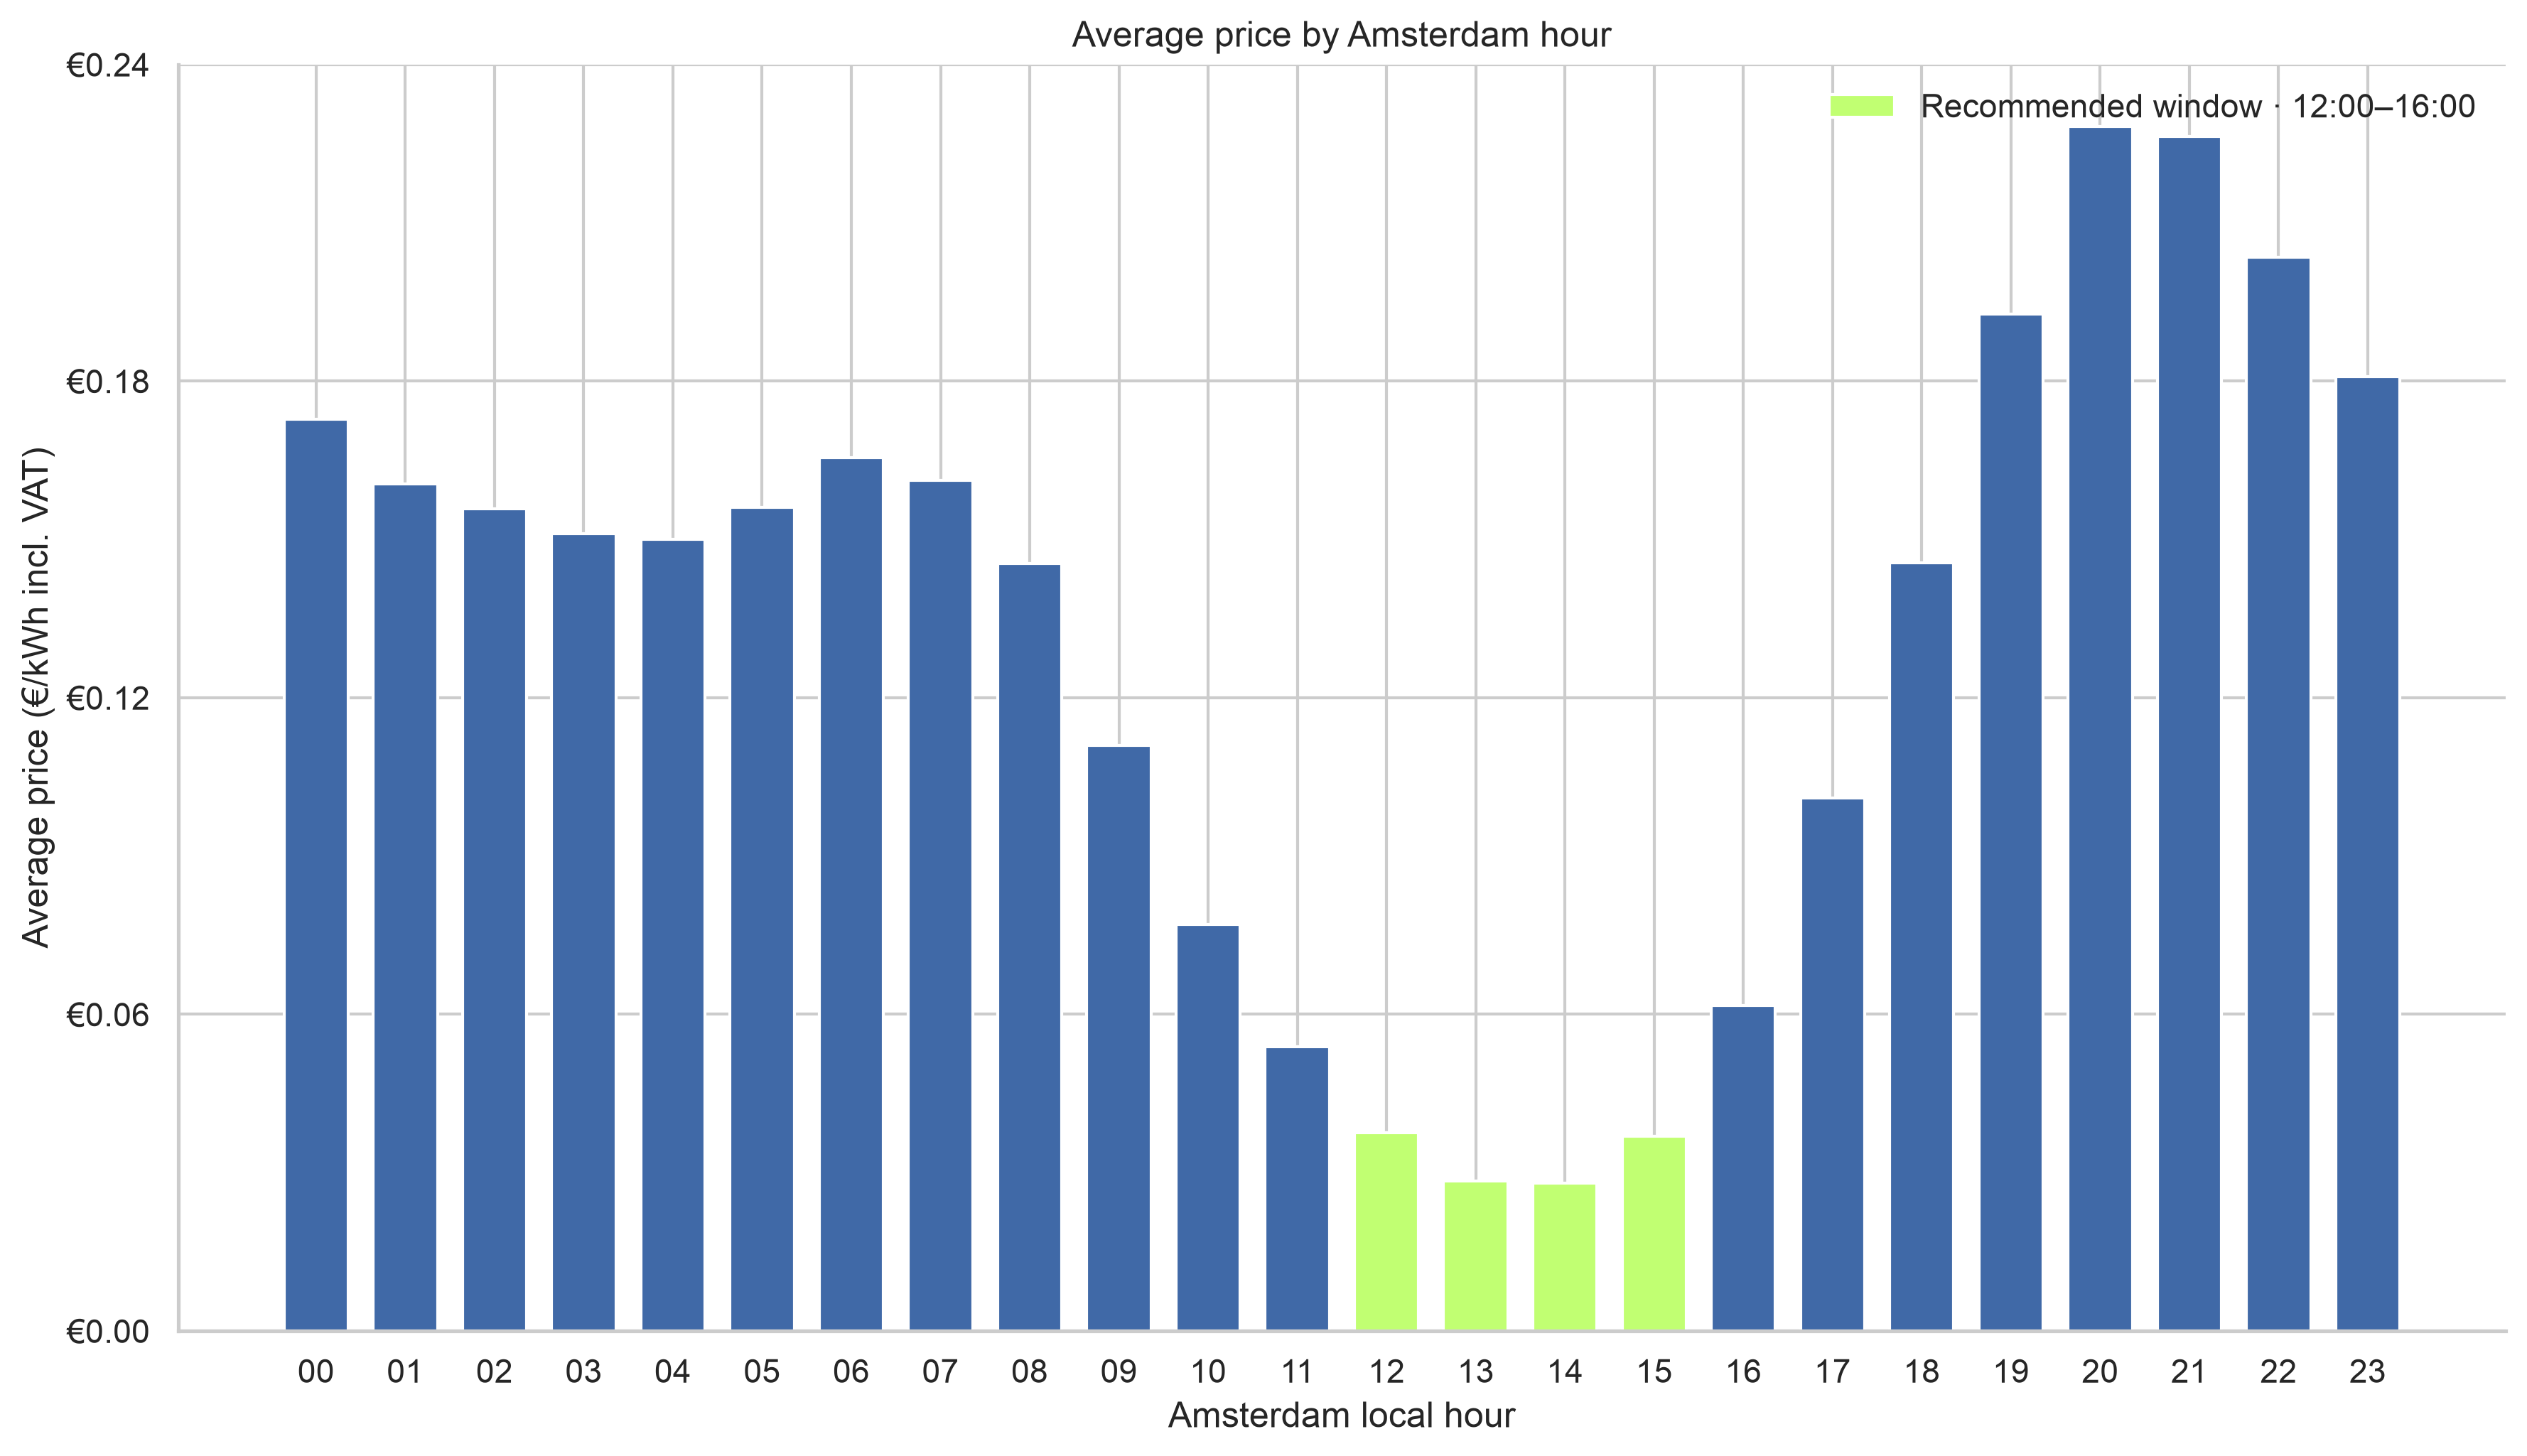
Midday stood out in the historical sample.
The analysis highlighted 12:00–16:00 Amsterdam time as the most practical recurring window in the observed period. The prototype is evidence from historical data, not a live electricity forecast.
From source to decision
The full workflow, not just the final chart.
- 01
Collect
Ingest price, carbon, weather, and demand data from four APIs.
- 02
Validate
Normalize time zones, align hourly observations, and test quality.
- 03
Structure
Transform and load the analysis-ready dataset into MySQL.
- 04
Explain
Turn patterns into a Tableau dashboard and Streamlit prototype.